Where in Europe are opportunities growing the fastest? The answer depends on more than economic output alone. While some countries have become hubs for innovation, entrepreneurship, and high-skilled employment, others face greater challenges in translating economic potential into growth. Understanding these differences helps reveal where opportunities are expanding most rapidly across the continent.
To identify where economic momentum is strongest, the team at PlayersTime compared 31 countries across a range of indicators linked to opportunity, business activity, and living standards. We then awarded points based on each country’s performance across these indicators, after standardising the data to ensure fair comparisons. The results are calculated by measuring how countries have changed over time and how they rank against each other across all categories, with the final score reflecting overall progress and growth potential in 2026.
We found out that Western and Northern Europe are leading the continent in opportunity growth for 2026, with Spain standing out as Europe’s leading hub for economic opportunity and innovation, followed by the Netherlands, Ireland, France, and Sweden. Meanwhile, several Southern and Eastern European nations, despite having solid economic potential, are struggling to translate that into real opportunities for residents.
Key Takeaways:
- Spain tops the ranking as Europe’s most promising country for future opportunities, driven by strong growth of 19.3% in startup business activity, rising property prices of nearly 6%, steady population growth, and workforce expansion.
- The fastest-growing countries in Europe for 2026 are mainly Western and Northern European nations, with Slovenia being the only Central European country to break into the top 10.
- While Western and Northern Europe continue to offer the highest income levels, the fastest wage growth is occurring in countries such as Serbia, Slovakia, and Croatia, where net annual incomes increased by between 45% and 65% between 2023 and 2025.
How is the ranking made?
Each metric in our analysis uses the latest available annual numbers, which lets us track growth over time. Countries were ranked by this growth across all indicators, opportunity, business activity, and living standards, and then awarded points from 1 to 31 based on their position in the ranking, with higher-performing countries earning more points. The final score combines these points to show overall progress and growth potential for 2026.
European Economic and Innovation Growth Leaders in 2026
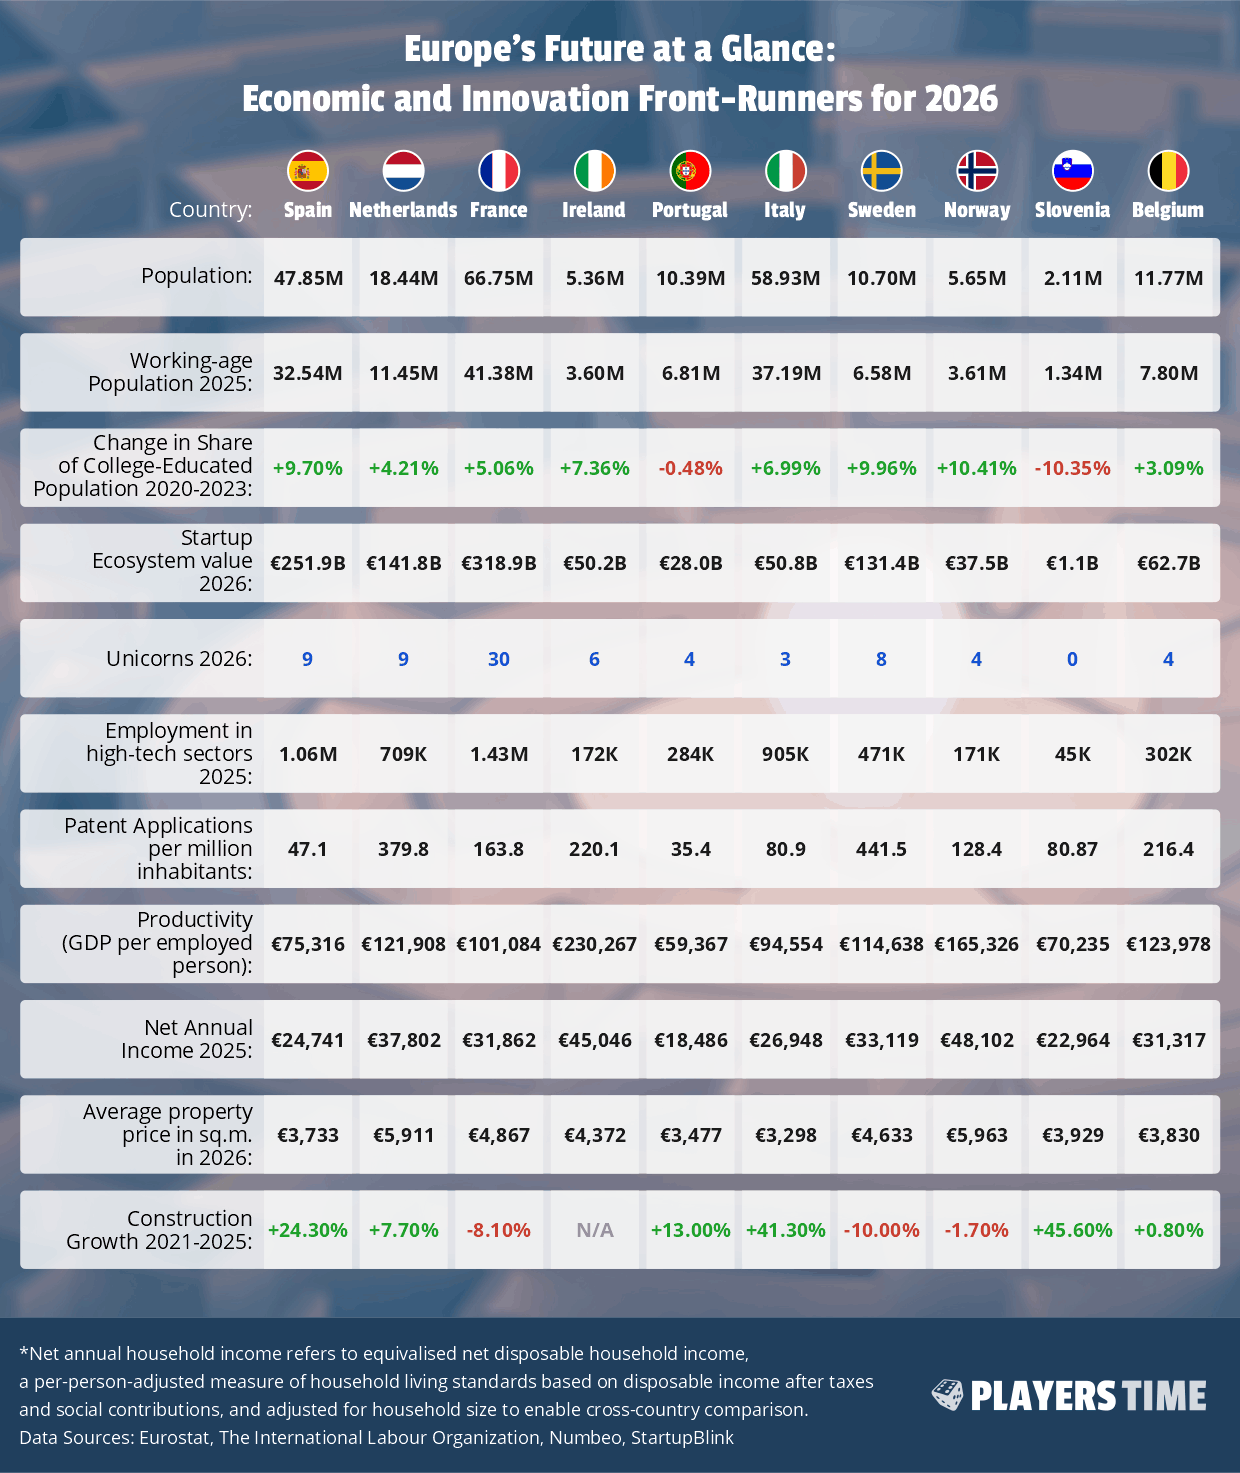
Spain looks like a country in full forward motion – it ranks as Europe’s fastest-growing economy right now, leading in almost all growth metrics across the board – from education to business, and even construction. With more than 32 million working-age people, a sharp rise in university education, a €251.9 billion startup scene, and construction activity climbing over 24%, it has the energy of a place where everything is expanding at once – skills, cities, and ambition.
The Netherlands and France sit at the heart of Europe’s innovation engine, but in very different ways. The Netherlands stands out when it comes to efficiency, boasting some of the highest productivity in Europe at €121,900 GDP per worker. Meanwhile, France’s strength lies in scale and density: a €320 billion startup ecosystem, 30 unicorns (private companies worth over $1 billion), and more than 1.4 million people working in high-tech roles.
Ireland stands small in size, but loud in impact. With productivity above €230,000 per worker and offering the second-highest incomes in Europe, after Norway, it behaves less like a traditional economy and more like a high-performance hub where each worker carries outsized economic weight.
Portugal rounds out the top five countries in Europe’s growth map. The country performs particularly well in entrepreneurship and workforce development, with nearly 7 million of its 10.38 million residents, around 65% of population, in the 15-64 working-age group, ranking among Europe’s leaders for startup growth of over 7%, business density, high-tech employment growth, and working-age population growth, up 1.5%. However, it also faces pressure in its housing market, where rising property costs are beginning to challenge affordability in major urban areas.
Beyond the front-runners, Europe becomes more textured and uneven, but not less interesting. Italy is building fast, almost urgently, with construction growth over 40%, Sweden is quietly stacking innovation gains, leading in patents and education, while Norway remains the benchmark for earnings, offering net annual income of over €48,000, the highest in the ranking. Slovenia stands out as the only country in Central Europe among the top 10, reshaping itself through construction despite educational dips, followed by Belgium, which sits in a steady middle ground where productivity and innovation move in balance.
Household Income Growth Across Europe: A Tale of Two Speeds
| Country | Net Annual Household income 2023 |
Net Annual Household income 2024 |
Net Annual Household income 2025 |
2-Year Growth in % |
|---|---|---|---|---|
|
Serbia |
€6,544 | €8,415 | €10,860 |
65.95% |
|
Slovakia |
€9,871 | €11,420 | €15,880 |
60.88% |
|
Croatia |
€12,690 | €16,024 | €18,595 |
46.53% |
|
Poland |
€12,740 | €14,620 | €17,643 |
38.49% |
|
Bulgaria |
€10,048 | €12,271 | €13,910 |
38.44% |
| Country | Net Annual Household income 2023 |
Net Annual Household income 2024 |
Net Annual Household income 2025 |
2-Year Growth in % |
|---|---|---|---|---|
|
Norway |
€47,459 | €45,715 | €48,102 |
1.35% |
|
Sweden |
€31,849 | €31,166 | €33,119 |
3.99% |
|
Belgium |
€29,260 | €30,849 | €31,317 |
7.03% |
|
Finland |
€32,690 | €33,572 | €35,275 |
7.91% |
|
Czechia |
€16,665 | €18,075 | €18,005 |
8.04% |
*Growth in average household income between 2023 and 2025, data for Switzerland not available
**Net annual household income refers to equivalised net disposable household income, a per-person-adjusted measure of household living standards based on disposable income after taxes and social contributions, and adjusted for household size to enable cross-country comparison.
If you look at how net annual income changed between 2023 and 2025, Europe feels like two different worlds moving at totally different speeds.
In Central and Eastern Europe, money is moving faster. Net annual household incomes are rising sharply, and people are actually feeling it in their daily lives. Serbia’s movement is most impressive: up nearly 66% in just two years, from €8,415 to €10,860. That’s not a small tweak, that’s a real shift in what households can afford.
Slovakia is right behind, with 60.88% growth and a net annual income of €15,880. Croatia, Poland, and Bulgaria are all up more than 38%. These countries might still start from lower levels, but the pace is serious. People there are seeing their earnings and living standards move in a meaningful way.
Meanwhile, in Northern and Western Europe, income is still growing, but at a slower pace. Norway has the smallest increase at 1.35%, but its net annual household income stands at around €48,100, the highest in Europe. Sweden is up 3.99%, with income above €33,100. Belgium, Finland, and Czechia are all in the 7-8% range, lifting household income by roughly €1,340-€2,585 over those two years.
Europe’s Fastest-Growing Property Markets in 2026
Jumped the Most in the Past Year
Ranked by 2025-2026 increase
in average city-centre apartment prices per square metre
Data Source: Numbeo
Certain countries are seeing strong growth in property values and urban development, which often signals a place that’s becoming more attractive for people to live, work, and invest.
The top three are moving fast. Switzerland leads with a 14.8% annual jump, hitting around €16,400/m² in city centres, the most active high-end market in Europe. Malta follows with 12.1% growth, reaching€3,860/m², where tight land and strong demand keep the scene buzzing. Hungary is up 11.6%, with city-centre prices averaging €3,350/m², showing Central Europe’s housing market is definitely heating up.
Beyond those three, the momentum continues in a bunch of other markets. Denmark, the Netherlands, and Belgium are all climbing steadily with nearly 10% each in already high-value areas, especially in cities like Amsterdam, Rotterdam, and Brussels, where demand stays tight. Spain is up 5.8% at €3,730/m², reflecting steady growth across one of Europe’s largest housing markets. Czechia (+7.3%) and Romania (+6.7%) are also climbing, with Romania still the most affordable at around €2,250/m², a solid pick for value with growth. Ireland rounds out the top 10 with +5.5% at €4,370/m², sitting in the mid-range: above the cheaper markets, but still below Europe’s priciest cities.
Europe’s Rising Innovation and Business Hubs
| Country | Annual Ecosystem Growth | Cities in Top 1,000 Startup Hubs | Ecosystem Value (Billions) | Number of Unicorns |
|---|---|---|---|---|
|
Spain |
19.30% | 37 | €251.9B | 🦄 9 |
|
UK |
13.20% | 70 | €860.3B | 🦄 52 |
|
Germany |
13.50% | 49 | €389.9B | 🦄 31 |
|
Sweden |
15.50% | 14 | €131.4B | 🦄 8 |
|
Switzerland |
13.70% | 16 | €125B | 🦄 6 |
|
Italy |
25.40% |
29 | €50.8B | 🦄 3 |
|
Netherlands |
11.80% | 22 | €141.8B | 🦄 9 |
|
France |
4.70% |
27 | €318.9B | 🦄 30 |
|
Ireland |
14.50% | 6 | €50.2B | 🦄 6 |
|
Finland |
13.20% | 8 | €66.4B | 🦄 4 |
Data Source: StartupBlink Database
Some countries are turning into magnets for talent, fresh ideas, and new businesses, while others are still building progress behind the scenes.
Spain emerges as the top country in Europe’s innovation and business ranking, scoring high across all the metrics: number of cities with startups, number of billion-dollar companies, total market value, and growth pace. Some of the country’s strongest advantages are a 19.3% rise in activity and a market worth €251.9 billion spread across 37 cities.
Meanwhile, the UK is also a heavyweight, even with slower growth at 13.2%. It’s Europe’s biggest startup market by far: €860.3 billion, 70 cities, and 52 billion-dollar companies. Germany also keeps moving forward, its ecosystem value up 13.5% to €389.9 billion, with 31 billion-dollar companies giving it serious depth.
Beyond those three, a bunch of other countries are catching the wave. Italy is the breakout star, with the fastest growth in the group at 25.4%, reaching €50.8 billion across 29 cities. Sweden and Switzerland are both posting strong double-digit growth and proving that smaller markets can still punch above their weight. The Netherlands keeps building steadily, hitting €141.8 billion and is home to 9 unicorn companies. France grows more slowly, but it remains one of Europe’s biggest innovation markets at €318.9 billion, with 30 billion-dollar companies showing real depth. Ireland and Finland round out the top 10, both still moving forward with solid growth and rising value.
Europe’s Changing Workforce Map
Data Source: Numbeo
Europe’s working-age population is growing unevenly, with smaller, faster-moving economies pulling ahead while larger ones slow or even register negative results. At the top, Malta recorded the strongest surge between 2024 and 2025, adding over 10,000 people aged 15 to 64, a 2.67% rise to 403,300. That’s not just numbers, it’s a sign that more people are choosing to stay and build their lives at home, rather than migrate abroad for work. For a small country, that kind of momentum is a real win.
Ireland, a country where young professionals see real opportunity, follows with a 1.77% increase, climbing from 3.54 million to 3.6 million. Portugal ranks third, and it has been working hard to make life more attractive for younger generations – better entry-level jobs and a growing startup scene that gives people a reason to stay and build their careers at home. The coastal country shows strong results, growing from 6.71 million to 6.81 million, up by 1.50%.
The UK and France are bringing in big numbers: the UK added nearly 590,000 working-age people in a year, and France added more than 460,000. Spain continues to expand as well, though more moderately, expanding its working-age population by only 0.76%.
Further down the scale, in countries like Croatia, Belgium, the Netherlands, and Slovenia, the working-age population is barely shifting. Past that, things actually go negative: Italy is almost flat, Germany and Romania are shrinking, and Serbia is the sharpest fall at -1%. In these places, more young people are leaving than staying, which drains the workforce and slows momentum.
Population Trends in 2026
*2026 figures estimates/projections from the source, not census counts
Data Source: World Population Review
In most countries, populations have faced a decline within the past year, and in many cases even small percentage changes translate into meaningful long-term shifts given their size. Meanwhile, only a limited group is still expanding. Europe’s population is splitting into two very different stories.
On one side, there’s a small group of countries that are still adding residents. These are often smaller, dynamic economies: Luxembourg, Ireland, Cyprus, Malta, the Netherlands, and parts of Northern Europe like Norway, Switzerland, Sweden, and Denmark. The UK and France are growing more slowly, but they’re still moving up. These places tend to have stronger job opportunities, more attractive cities, and better chances for young people to stay instead of leaving.
On the other side, many countries are starting to lose people, not dramatically, but consistently. Spain is almost flat, Portugal and Italy are declining, and Greece and Germany are both dropping by nearly 0.5%. The sharpest losses are in the east and the Baltic region, especially Lithuania. In these countries, the trend is often the same: young people leaving for work abroad, fewer births than deaths, and slower momentum overall.
The Shifting Map of Europe’s Growth
Across Europe, growth is becoming less about size and more about momentum. The countries pulling ahead are those that attract people, support business creation, and create conditions where incomes and opportunities can grow together.
The result is a more uneven but increasingly dynamic map of Europe, where smaller and more agile economies are gaining ground, and factors such as housing, labour markets, and quality of life are playing a larger role in shaping economic performance.
Methodology
This report combines a range of datasets that cover demographics, economic activity, innovation, and housing. These include: European Countries Population 2026; Working-Age Population Growth; Growth in Share of College-Educated Population; Business Demography; Startup Ecosystem 2026; Employment in High-Tech Sectors; Patent Applications (based on EPO data); Productivity (GDP per worker); Income and Wage Growth; Construction Index; and Housing Prices.
The metrics are sourced from recognised international providers, including Eurostat, the International Labour Organization, Numbeo, and StartupBlink. To ensure comparability across countries, figures have been standardised where needed. Income data is based on net household income using harmonised EU methodology, while population and workforce figures reflect annual percentage changes. Property prices refer to average city-centre apartment costs per square metre, and startup data captures ecosystem growth, scale, and activity.
The PlayersTime team constructed the metrics by comparing past years up to the latest available year, as the time-based comparison serves as the report’s main analytical lens, which allows for measuring growth, ranking countries by their performance, and highlighting where momentum is most visible in 2026.